One launch per token
Generating a token from a small model is a memory-streaming problem wearing a compute costume. So I fused a whole decode step into one CUDA-graph launch, in from-scratch Triton, until the GPU did nothing but drag weights past the memory controller, and beat vLLM's batch-1 latency on a 4090. Then I did it for a 64-expert MoE. Then I rented two H100s to make it faster and made it slower.
When you generate one token from a 1.5B model, the GPU is barely awake. Every weight matrix is a matrix times a vector, one column of work, so the tensor cores that make GPUs worth owning sit idle, and the entire step is (bytes of weights) ÷ (memory bandwidth). On my 4090 that floor is 3.06 ms per token, and nothing you do to the math can beat it. What you can beat is everything else: the ~1200 tiny kernel launches PyTorch fires per token, the HBM round-trips between them where a 1536-number activation gets written out and read back for no reason, the CPU queuing work at 30µs a pop while the GPU finishes early and waits. Batch-1 decode latency is mostly that overhead, and the tidiest way to delete it is to stop having separate kernels at all: run the whole step as one fused thing, captured into one launch, so the card streams weights back-to-back with nothing in between.
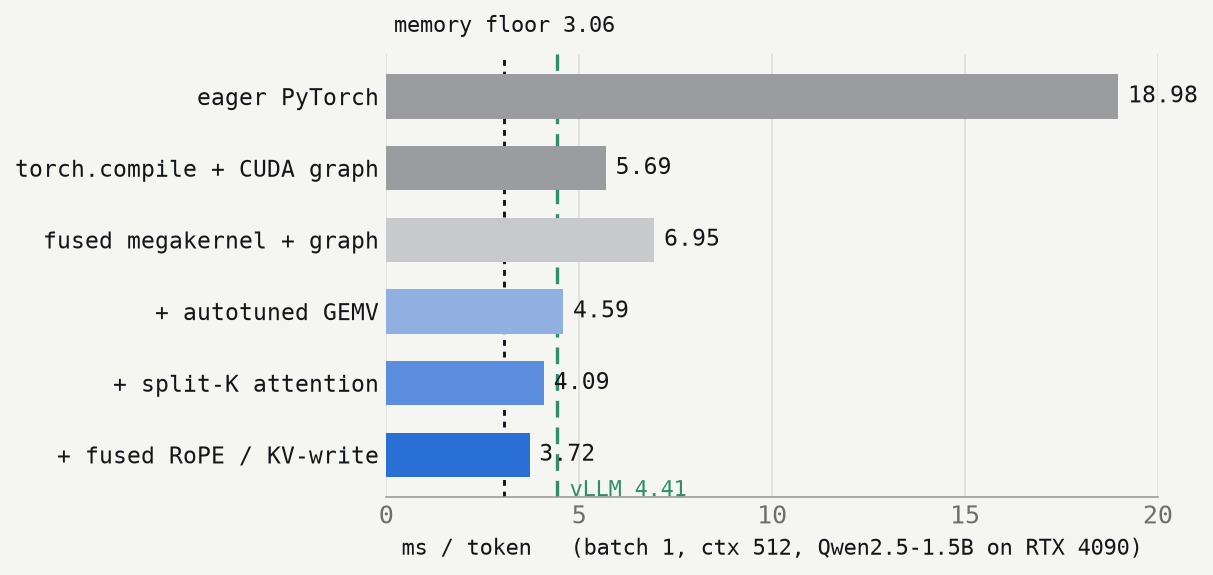
torch.compile (6.95 vs 5.69) and stays that way until the kernels are actually tuned; the last three steps are where fusing stops being a liability and ends at 3.72 ms, under vLLM, at 1.21× the memory floor. The whole point is the gap between that bottom bar and 3.06.Before this turns into something it isn't: fusing the whole forward pass into one persistent "megakernel" is not my idea. Mirage's MPK compiles a model into exactly this; Hazy Research's megakernels do it by hand for Llama-1B and are where I got the nerve to try. And "beat vLLM" is a narrow claim: vLLM is built to keep a big GPU full of many concurrent requests, which is a different and harder job than making one request on a small model go fast, and it is better than me at its own job. What's here is the from-scratch, consumer-hardware version, checked honestly against vLLM at the one thing this is tuned for, with the same MoE trick underneath and a tensor-parallel result that didn't go the way I planned. Full accounting of what's borrowed at the bottom.
The oracle, then the kernels
You cannot optimize a kernel you can't check, so the first thing I wrote wasn't a kernel. It was Qwen2.5-1.5B's decode step in plain PyTorch, op by op (RMSNorm, QKV with its Qwen bias, RoPE, grouped-query attention, the SwiGLU MLP) matching Hugging Face's logits to fp16 tolerance and its greedy tokens exactly. That reference is the thing every kernel gets diffed against on every run: fuse an op, confirm the argmax over 8 generated tokens still matches, move on. It caught every bug I'm about to describe before it reached a benchmark, which is the only reason the benchmark numbers are worth reading.
Then the decode step becomes six Triton kernels a layer, each written so every weight is read from HBM exactly once and the cheap glue rides along in the same launch instead of paying for its own:
- Fused RMSNorm + QKV. One kernel normalizes the residual, then does the Q, K and V projections as a single GEMV against a concatenated weight, bias folded into the epilogue. At batch 1 a projection is a matrix-vector product, so these are memory reads with a multiply-accumulate stapled on.
- Fused RoPE + KV-cache write. Rotary embeddings and the write into the paged cache, as one kernel, computing
rotate_halffrom a gathered index so there's no concatenation. This one launch replaces about fourteen tiny PyTorch ops. - Split-K flash-decode attention, its own section below, because the obvious version is a trap.
- Fused RMSNorm + gate/up + SwiGLU, and a final down-projection with the residual add in the epilogue.
Accumulate in fp32, store the residual stream in bf16, keep the 1536-wide activation in registers across the whole layer so it never touches HBM between the big matrices. Correct on the first honest try; slow on the first honest try.
Slow, because the launches are still there
The fused kernels, run eagerly, clocked 7.79 ms, better than eager PyTorch's 18.98, worse than torch.compile. Because the fusion only removed the HBM round-trips; the ~170 remaining launches still cost more in CPU dispatch than the kernels spend moving bytes. The fix is the whole reason serving engines exist: capture the entire step into a CUDA graph, so the CPU issues one call and the GPU walks the recorded launch list with no gaps.
The complication is that decode isn't shape-stable: the sequence grows by one every token, which changes the attention loop and would need a fresh graph each step. So everything that changes per token lives in a static GPU tensor the one graph reads on replay: the input token, the position, the KV write slot, and the attention length. Attention loops over a fixed maximum and masks against the current length read from GPU memory, so the recorded launch is byte-identical every step while the sequence grows underneath it. Capture once, replay forever. That took the fused step from 6.95 to the numbers worth caring about, but only after two more fights.
Drag across the optimization steps. Two reference lines: vLLM (SOTA) and the memory-bandwidth floor.
torch.compile baseline down, one step at a time, with what each step bought (eager's 18.98 is off the top, see the bars above). Note the first move goes the wrong way: the fused kernel, untuned, is slower than compile. The step that fixes it is autotuning the GEMV: a batch-1 GEMV wants small row-blocks so there are enough programs to fill all 128 SMs, and my first cut used blocks so large the down-projection ran on 24 of them and starved. Drag onto "autotune" to watch that one change cross the vLLM line.The attention trap
The obvious flash-decode kernel runs one program per query head. That's fine for prefill, where there are thousands of positions to parallelize over. At decode there's one position, so twelve query heads means twelve programs: twelve of the 4090's 128 SMs doing work, each serially walking the entire KV cache, the other 116 idle. It measured 0.75 ms and about 24 GB/s, which for a kernel touching 18 MB is an insult.
The fix is the flash-decoding move: split the KV timeline into chunks, run heads × chunks programs so the whole card fills, have each do an online-softmax pass over its slice, and a second tiny kernel merges the partials with the standard exp(m_local − m_global) rescale. A chunk entirely past the current length contributes m = −∞ and gets zeroed by its own combine weight, so the same fixed-shape launch works at every context length, which is what the CUDA graph needs. Attention dropped to 0.24 ms. It also broke, silently, the first time: my inner loop read a block wider than a chunk, so each split reached into its neighbor's tokens and double-counted them. The oracle caught it (argmax agreement fell to 6/8) where a benchmark would have happily reported a fast wrong number.
After all of it, every kernel sits at its floor. The step is 3.72 ms and breaks down like this:
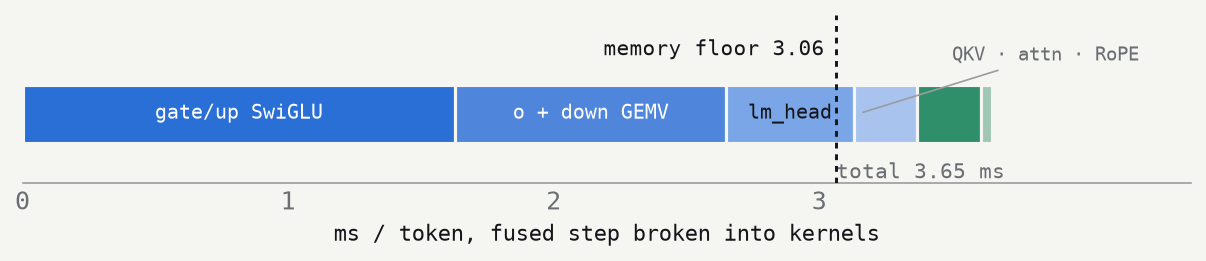
lm_head is a plain cuBLAS matmul at 97%. There's no fat left to render: the gap to 3.06 is the fixed cost of attention plus the small QKV/o matrices, which are too little work to fully hide launch and tail effects even inside a graph. On the 4090 that's a 1.21× overhead. It is not zero and I'm not going to pretend it is.The same trick, sparser: a 64-expert MoE
The interesting thing about a mixture-of-experts model at batch 1 is that it's less work than its size suggests, not more. OLMoE-1B-7B has 6.9B parameters but routes each token to 8 of its 64 experts per layer, so the weights you actually read, and the memory floor you're actually fighting, are the active ones: about 1.3B, 2.36 GB, a floor of 2.34 ms. The 7B is mostly experts this token never touches.
Which experts, though, is decided by a router at runtime, and that's the part that looks incompatible with a CUDA graph: the graph is a fixed recording, and routing changes every token. The resolution is that the shape is fixed even though the choice isn't: it's always 8 experts. So the router writes the 8 chosen expert IDs into a static GPU tensor, and the expert kernels read their weights through that indirect index: one kernel does the gated/up SwiGLU for the 8 selected experts gathered by ID, another does the down-projection and the weighted sum. The recording never changes; the pointers it follows do. OLMoE also normalizes its Q and K before RoPE, which the dense model doesn't, so that folded into the rotary kernel too.
| OLMoE-1B-7B decode | ms / token | tok/s |
|---|---|---|
| eager PyTorch | 19.53 | 51 |
| vLLM 0.11 (SOTA) | 3.70 | 270 |
| fused MoE megakernel | 3.28 | 305 |
| active-weight floor | 2.34 | 431 |
1.13× under vLLM, 1.40× off the active floor, verified 12/12 against the oracle through real generated text. The same playbook as the dense kernel, with routing bolted on, which is the whole reason to have built the dense one first.
Two H100s, and a plan that didn't work
Here's the reasoning that sent me to RunPod. Batch-1 decode is bound by how many bytes each GPU reads. Split the weights across two GPUs (Megatron-style, each holding half the heads and half the MLP channels) and each reads half the bytes, so the floor halves. The only new cost is an all-reduce of the 1536-wide residual after the attention and MLP blocks, a few kilobytes, tiny. Two GPUs, half the floor, latency below what one card can physically do. I rented two H100s with NVLink to watch it happen.
It didn't happen.
| 2× H100 SXM, dense Qwen | ms / token |
|---|---|
| one H100, same code path | 2.82 |
| two H100s, compute | 2.06 |
| two H100s, all-reduce comm | +0.92 |
| two H100s, total | 2.98 |
Splitting the weights did cut compute, 2.82 → 2.06. But the all-reduce cost 0.92 ms and ate the entire saving, so two H100s came out a hair slower than one. The reason is a thing I knew abstractly and had to pay to feel: those all-reduces are tiny, and tiny collectives are latency-bound, not bandwidth-bound. Two per layer across 28 layers is 56 round-trips at ~16µs each of pure NVLink latency, and 56 × 16µs is most of a millisecond no matter how fat the link is. Halving the weight-read time only helps if the weight-read time was the thing dominating, and on an H100, 3.3× the 4090's bandwidth, the weights fly by so fast that the fixed comm latency is now the bigger number. Tensor-parallelism buys latency when the model is big enough or the per-GPU bandwidth slow enough that streaming dominates comm. A small model on a fast card is neither. TP is a real tool; this was the wrong job for it, and the honest version of this post is the one where I say so instead of quietly not mentioning part three.
One caveat that cuts slightly in TP's favor, kept here because leaving it out would be the same dishonesty: NCCL collectives wouldn't capture inside my CUDA graph on the pod's stack, so the 0.92 ms comm is measured eagerly, with per-call launch overhead the graph would have amortized. A fused, captured comm path would be lower, maybe enough to reach break-even, not enough to change the conclusion. The sharding math itself is verified: argmax-identical to the single-GPU oracle, 8/8.
The stuff that broke
Three that cost real time. The split-K double-counting above, invisible except to the oracle. A CUDA-graph hang on the H100s that pinned both GPUs at 0% utilization forever: capturing an NCCL collective desyncs the two ranks unless you set NCCL_CUMEM_ENABLE=0 and barrier before capture, and even then, on that torch/NCCL build, it simply won't, which is why the comm number is eager. And an out-of-memory on my own machine from loading the 14 GB OLMoE twice (once for my weights, once for the reference) on a 24 GB card, fixed by having both read from one set of tensors, which is the kind of bug you write at 1 a.m. and diagnose at noon.
What this is and isn't
It isn't a serving engine: batch 1 only, no continuous batching, no scheduler, no paged-allocator bookkeeping, two specific models. "Beats vLLM" means beats it at single-stream latency on a small model, the one regime this is built for and the one vLLM isn't. Turn on real concurrency and the comparison inverts, as it should. The megakernel idea is Mirage's and Hazy Research's; the two-stage decode attention is Dao et al.'s flash-decoding; the sharding is Megatron's; vLLM is the SOTA baseline and NVIDIA's CUDA graphs are the thing doing half the work. What's mine is the from-scratch Triton, the oracle-checked correctness at every step, the indirect-indexed MoE experts, and a tensor-parallel experiment reported at the value it returned, which was a lesson rather than a speedup. Code, kernels, the reference oracle, and every number here are at github.com/haregali/onelaunch.
Decode is a memory-streaming problem, and the fastest a memory-streaming problem can go is the speed of the memory with nothing in the way. Most of this project was removing things from the way: the launches, the round-trips, the idle SMs, and finally the second GPU I'd added to help.
Benchmark methodology & versions
Because a latency ladder with no rig behind it is a mood board.
| GPUs | RTX 4090 (dense + MoE); 2× H100 80GB SXM, NVLink (tensor-parallel), RunPod |
| Driver / CUDA (4090) | 570.211.01 / 12.8 |
| PyTorch / Triton | 2.11.0+cu128 / 3.6.0 (dev); 2.4.1+cu124 on the pod |
| Models | Qwen2.5-1.5B-Instruct; OLMoE-1B-7B-0924-Instruct |
| SOTA baseline | vLLM 0.11.0, CUDA graphs on, decode isolated by subtracting a 1-token prefill |
| Config | batch 1, 512-token context, bf16, greedy |
| Timing | CUDA events, median of 100–128 iters after warmup, whole step captured as one graph |
| Correctness | argmax agreement vs a hand-rolled fp-reference over prefill + 8–12 greedy tokens, checked every run |
Everything reruns from the repo: python -m onelaunch.model_graph --bench (dense), model_graph_moe --bench (MoE), model_tp then torchrun … model_tp_dist (tensor-parallel), and model_ref* for the oracle checks.
References
- M. Zhang et al. Mirage Persistent Kernel: Compiling LLMs into a Megakernel. 2025. arXiv:2506.21335. The compiled version of the whole-forward-in-one-kernel idea.
- Hazy Research (Stanford). Low-Latency LLM Inference with Megakernels. 2025. hazyresearch.stanford.edu. Hand-built megakernels; the nerve to try this by hand.
- T. Dao, D. Haziza, F. Massa, G. Sizov. Flash-Decoding for Long-Context Inference. 2023. pytorch.org/blog/flash-decoding. The split-K decode-attention structure.
- W. Kwon et al. Efficient Memory Management for Large Language Model Serving with PagedAttention. SOSP, 2023. arXiv:2309.06180. vLLM, the SOTA baseline here.
- M. Shoeybi et al. Megatron-LM: Training Multi-Billion Parameter Language Models Using Model Parallelism. 2019. arXiv:1909.08053. The column/row tensor-parallel sharding.
- N. Muennighoff et al. OLMoE: Open Mixture-of-Experts Language Models. 2024. arXiv:2409.02060. The MoE model, QK-norm and all.
- NVIDIA. Getting Started with CUDA Graphs. developer.nvidia.com/blog/cuda-graphs. Why one launch beats a thousand.